Comparing Scalers
Normalize, Standardize, & RobustScale
FluCoMa has three scalers for scaling data (in a DataSet and/or a buffer): Normalize, Standardize, and RobustScale. Each transform data in different way, but all will position data into a space that could be considered “standard” (here used differently from the “Standardize” object), either ranging 0-1, or centred around 0 with the rest of the values in nearby positive and negative ranges.
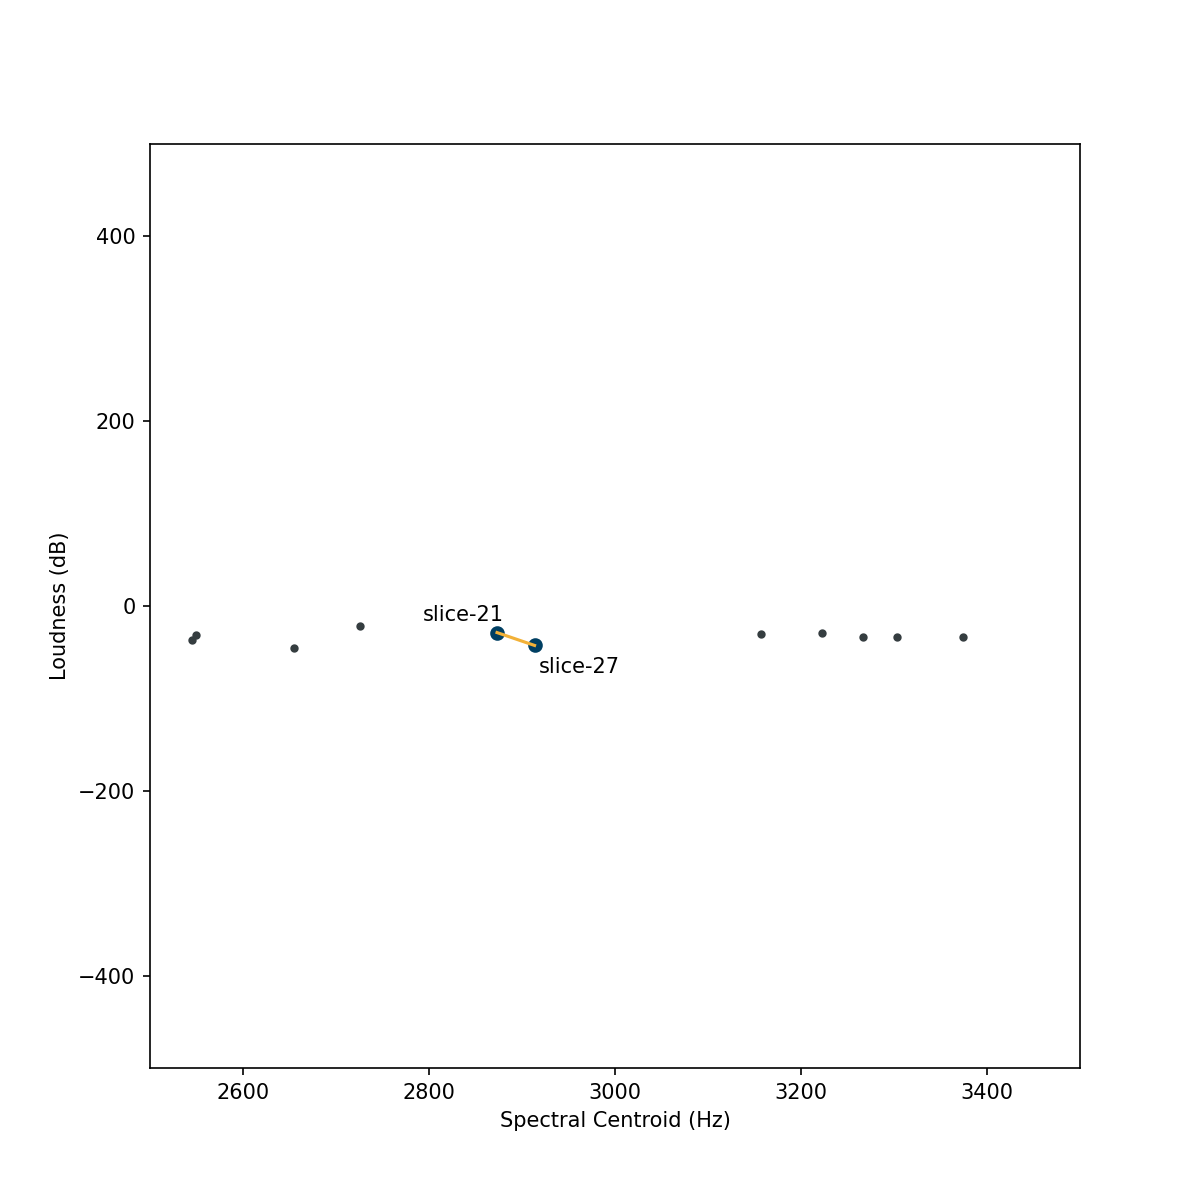
Below are plots of a sound slices, each of which is represented by a spectral centroid in Hz and a loudness measure in dB. The plots show different scalings of the data: the first is the raw data with the dimensions original ranges, and the next three are the three scalers found in FluCoMa. Notice that the dimensions of the raw data have very different ranges which means that when computing distance (i.e., similarity) the dimension with a larger range (spectral centroid) will have a much greater impact on the measured distance between points. This may be undesirable for use with many machine learning algorithms. See the Why Scale? page for more info.
Interactive Scaler Comparison
Select a scaling type below:
While each scaler transforms the data into a relatively similar range, they all have different strategies for doing so and therefore distort the data in different ways. For details about how each scaler works, visit their respective reference pages (Normalize, Standardize, and RobustScale). These different distortions can lead to meaningful results. Take for example the plots below, which show the same data set as above, but track the nearest neighbour of “slice-27” using different scalers.
Differences such as these can have meaningful impacts on the musical results. Choosing which scaler to use can be an important musical decision in the creative process, which may be based on some specific context (such as if you know there are extreme outliers), or decided by testing them and choosing which one produces the results you like the best.

