
Outliers
Some thinking about outliers and how to manage them.
What is an outlier?
Generally speaking, an outlier is a data point that is significantly different from the rest of the data points in a dataset. Identifying outliers is always a subjective exercise, as there is no objective measure for how significantly different a data point must be to be considered an outlier. Furthermore, one might consider why a data point is significantly different. If it is different because of an error, it may be important to consider it an outlier. If it is not in error, but merely is different, it may not be good to consider it an outlier.
To take one example, consider a recording of one trumpet tone (perhaps from a sample library). A pitch analysis may return a steady frequency for the majority of the duration (during the steady tone), however during the attack portion of the sound and during any silence that might be in the file the pitch analysis will likely return a value that doesn’t represent the majority of the sound file’s contents. These moments could be considered outliers.
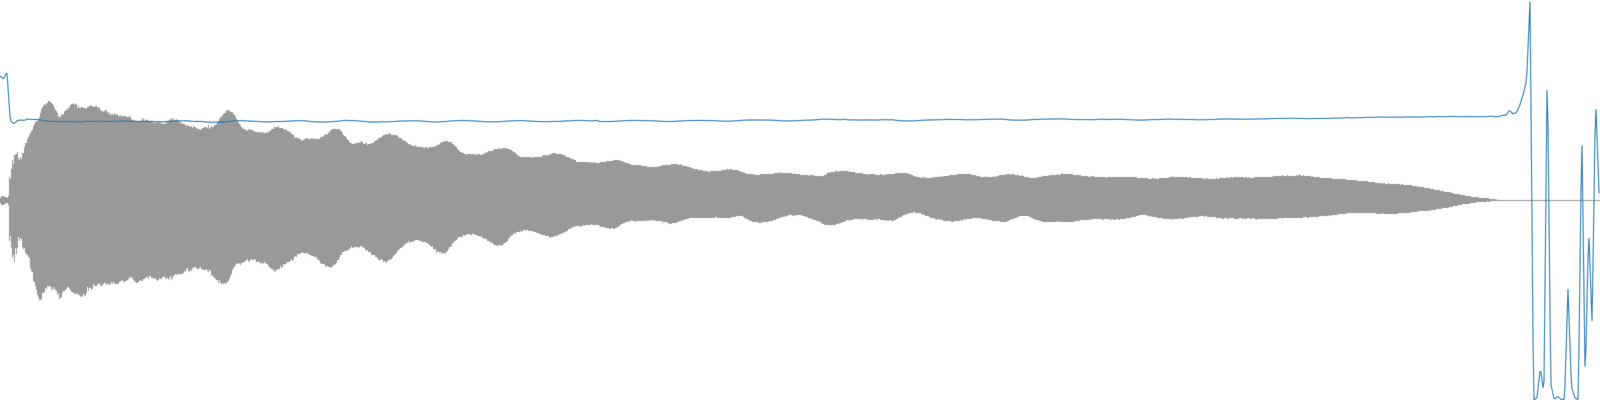
A trumpet tone with the pitch analysis overlaid.
For another example, consider the plot below. One might visually identify the cluster of points in the top left area to be outliers because them seem to be significantly separated from the rest of the data.
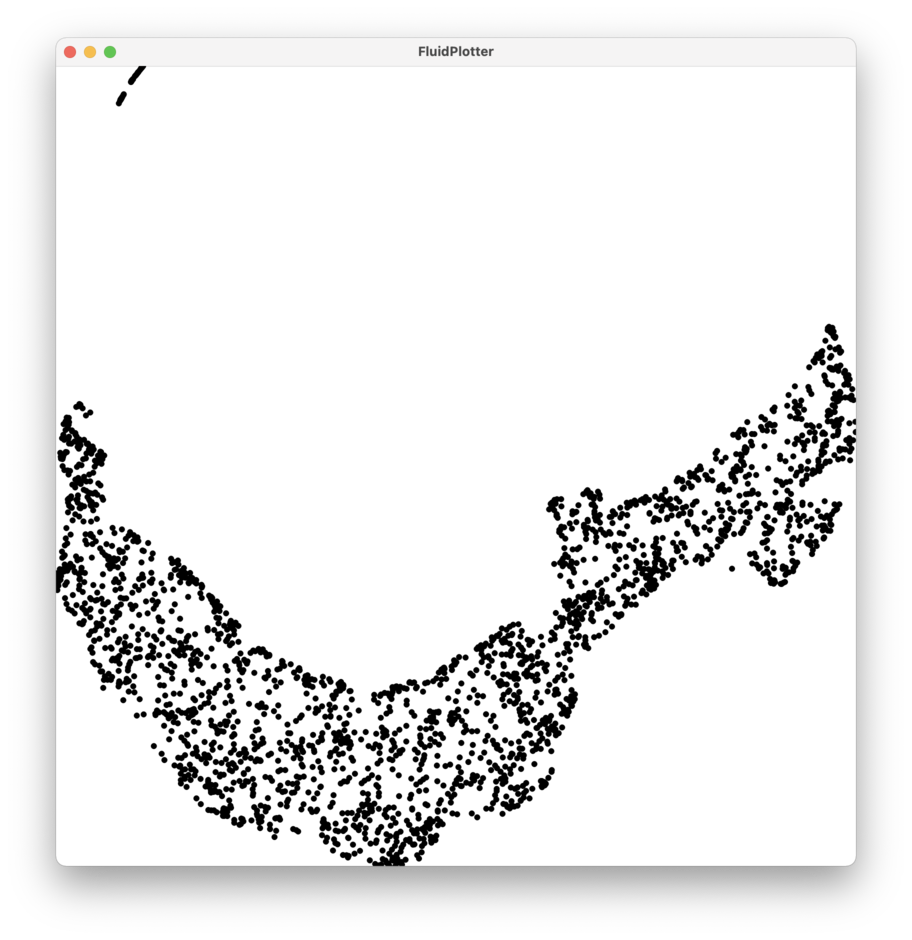
A plot with outlier candidates in the upper left section.
The data that created this plot is a UMAP reduction of MFCC analyses from the sound file below.
You can hear that most of the sound file contains a slow static timbre, but there are a few click sounds sprinkled throughout. You might be (correctly) assuming that the outliers are the MFCC analyses of the moments with clicks. By using the mouse function of the Plotter, you can find what values distinguish the cluster in the upper left from the rest of the data points (either in the 2 dimensional UMAP space, or in the original 13 dimensional MFCC space). Then, using DataSetQuery you could remove these outliers from a DataSet if you don’t want them included in your analyses. (Or, if clicks are what you’re interested in, you could remove the rest!)

A plot with the identifier outliers removed.
What Could Cause Outliers?
Given a big enough dataset some outliers are likely to occur. With smaller datasets (the size often used by musicians for creative purposes) outliers may occur in different ways. Outliers could be caused by:
- analysis edge cases (such as inaccurate pitch measurements during an onset)
- human error (such as mislabeled data)
- silence (which we often tend to not notice, but it still gets analysed!)
- data points that are accurately analysed but just happen to be significantly different from the other data points in the dataset
What Effect Can Outliers Have?
Outliers can greatly affect mean-related statistical measures of data (such as the first four statistics provided by BufStats), making them less representative of the majority of the data. This may lead to a misunderstanding of how the data is distributed, where it is centred, or what it represents. When outliers are causing a misrepresentation of the data and leading to false conclusions, it is often a good idea to try to remove them or mitigate them in other ways. It also may be important to investigate outliers to determine why they are significantly different from the rest of the data, and not merely throw out data points because they are different.
Might They Be Interesting?
Outliers are not always problematic. They may be musically more relevant than the other points in the dataset. For example, if one were to analyse and plot a folder containing a whole bunch of snare drum hits, many of the snare hits might be very similar and form a cluster of data points. What might be more musically interesting is to look for the snare hits that have unique characteristics and stand out when compared to the majority? Another way of considering this is to ask what snare hits are significantly different from the majority of the data points in the dataset?
Working With Outliers
If outliers are creating a misrepresentation and causing a misunderstanding of the data, there are some strategies one can use to mitigate these negative effects. Using the median (also called the 50th percentile) as a measure of central tendency is robust to outliers, meaning that it is not affected by outliers that are very distant from this central tendency. The mean as a measure of central tendency is not robust to outliers, which can negatively impact it’s explanatory power. See BufStats for more on using the median and mean.
RobustScale
The scalers Normalize and Standardize are not robust to outliers so may provide results that misrepresent the majority of the data. The scaler RobustScaler uses percentiles (also called order statistics) for scaling data, making it, ahem, robust to outliers.
Removing Outliers With BufStats
Another strategy for managing outliers is to use the outliersCutoff feature of BufStats, which can find and remove outliers by using an analysis of the data to set boundaries for each channel in the buffer. Any frames that have a value outside its channel’s boundaries will not be used to compute the statistics. See the page on removing outliers to learn more.
Weighting BufStats
The weights parameter of BufStats can be passed a buffer, the values of which will be used for relative weighting of each corresponding frame in the source buffer. This will create “weighted” statistics where some values in the data have more impact on the resulting statistical summary than others. weights could be used to decrease the impact of potential outliers on the resulting statistics. See the page on weighting stats to learn more.
For example, this could be useful for weighting certain moments in descriptor time-series by the value of other descriptors. One might want to weight the influence of pitch analyses using the pitch confidence descriptor so the resulting mean pitch value is more strongly influenced by moments in the analysis when the pitch confidence is high. Similarly, one might want to weight a descriptor time-series (such as MFCC) by amplitude so the louder moments of the sound slice have greater impact than the quieter moments on the resulting statistical summary.
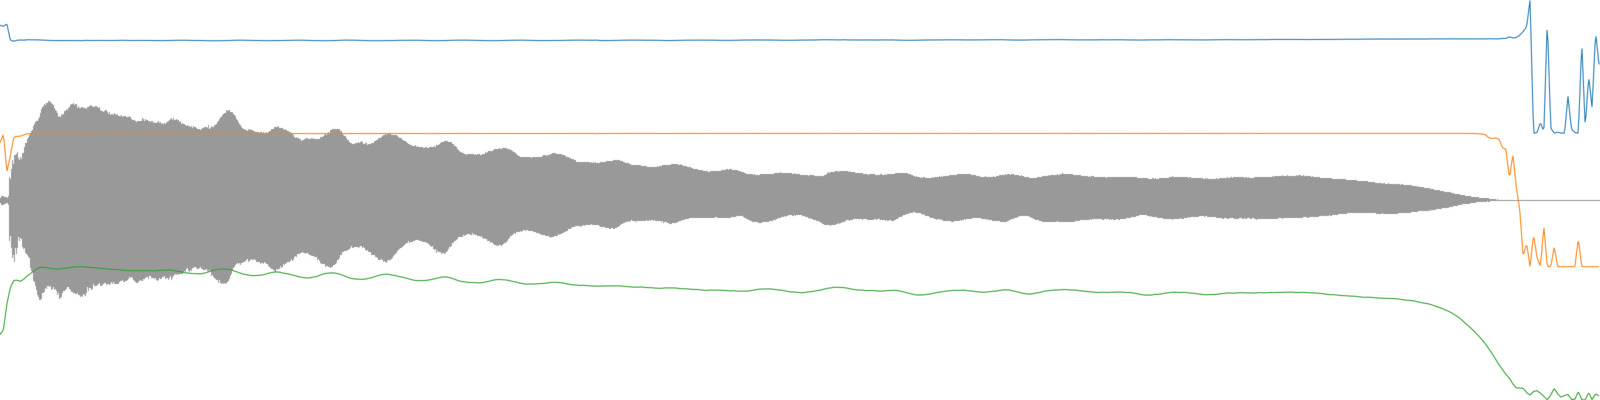
A trumpet tone with the pitch analysis (blue), pitch confidence (orange), and loudness (green) overlaid.