
MelBands
Magnitudes for a number of perceptually-evenly spaced spectral bands
MelBands returns a Mel-Frequency Spectrum which is computed by bundling subsets of FFT bin magnitudes according to their relationship to the Mel scale (the name “Mel” derives from the word “melody”). The Mel scale represents frequency space linearly up to 700 Hz and logarithmically above that, mimicking how humans perceive pitch space. Because the Mel-Frequency Spectrum relates to how humans perceive the spectral shape of sound, it can make for a more relevant audio descriptor (than FFT spectra) for considering how humans compare and hear different sounds.
An illustration of the different steps involved in computing Melbands, beginning from an FFT spectrum (in grey). Each colour represents a triangle filter.
In order to create the Mel-Frequency Spectrum, first an FFT is computed on a window of the signal. Next, a series of overlapping triangle filters are applied to the magnitudes of the FFT spectrum: each magnitude in the FFT spectrum is multiplied by its corresponding value in the each triangle filter. These products are then added up to produce a weighted sum of FFT magnitudes for each triangle filter, which is the magnitude of the corresponding MelBand. Since most of the values in these triangle filters are zero (everywhere except where the triangle rises up) each filter only sums the magnitudes in a certain frequency band, so each MelBand magnitude is a representation of the overall energy in that frequency band. The MelBands are perceived as being equally spaced because as they get higher in frequency, they cover more FFT bins (more hertz), mirroring how humans perceive pitch relationships (higher frequency pitches have more hertz between musical intervals).
One can choose whether to normalize triangle filters used to compute the MelBands. By default (normalize = 1), normalization will account for how many FFT magnitudes each triangle filter sums together by dividing the sum by the number of contributing FFT magnitudes, essentially averaging their contributions. When the triangle filters are not normalized (normalize = 0), averaging does not occur and the magnitudes of the higher MelBands end up being larger values (disproportionately so) because they’re summing together more FFT magnitudes. In the charts below, notice how different the unnormalized and normalized triangle filters are and when normalized, how much larger the magnitudes in the higher MelBands become.
Normalized Triangle Filters (the default)
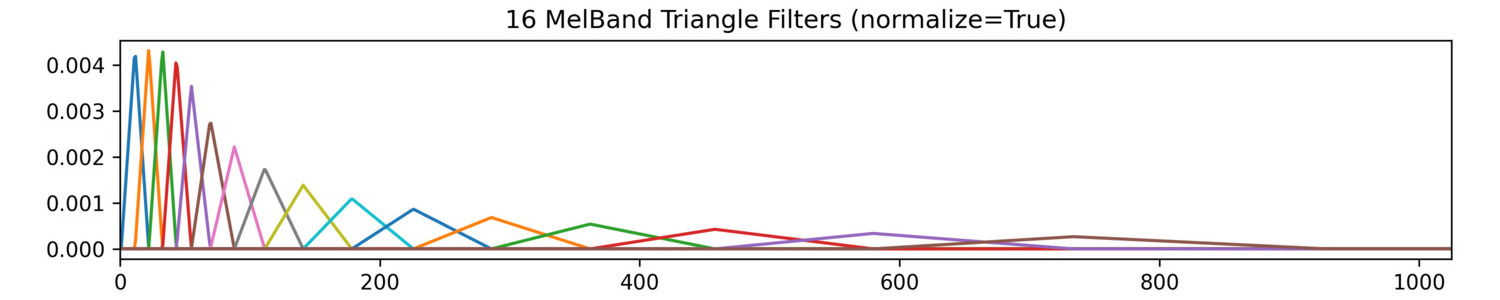
Normalized Triangle Filters
Unnormalized Triangle Filters
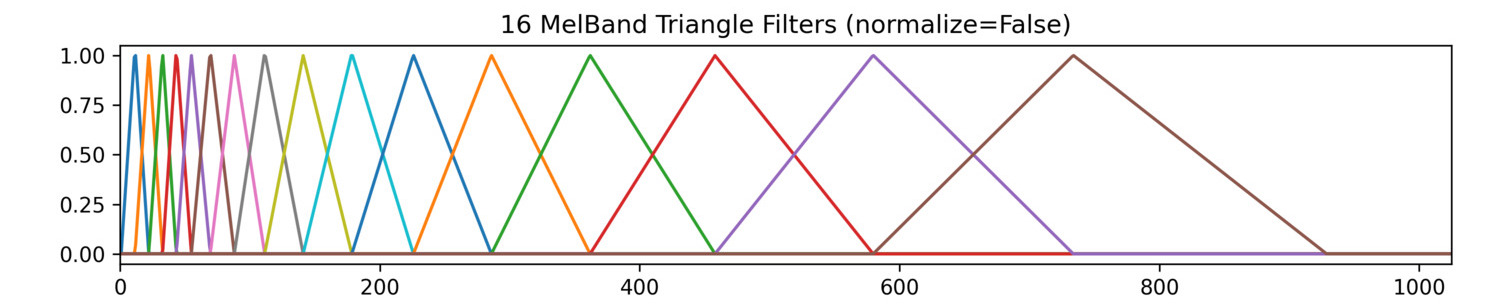
Unnormalized Triangle Filters
The Hz-to-Mel conversion used by MelBands is mel = 1127.01048 * log((hz / 700.0) + 1.0).
When using a high value for numBands, you may end up with empty channels (filled with zeros) in the MelBands output. This is because there is not enough information in the FFT analysis to properly calculate values for every MelBand. Increasing the fftSize will ensure you have values for all the MelBands.
MelBands analysis of one spectral frame of a drum loop.
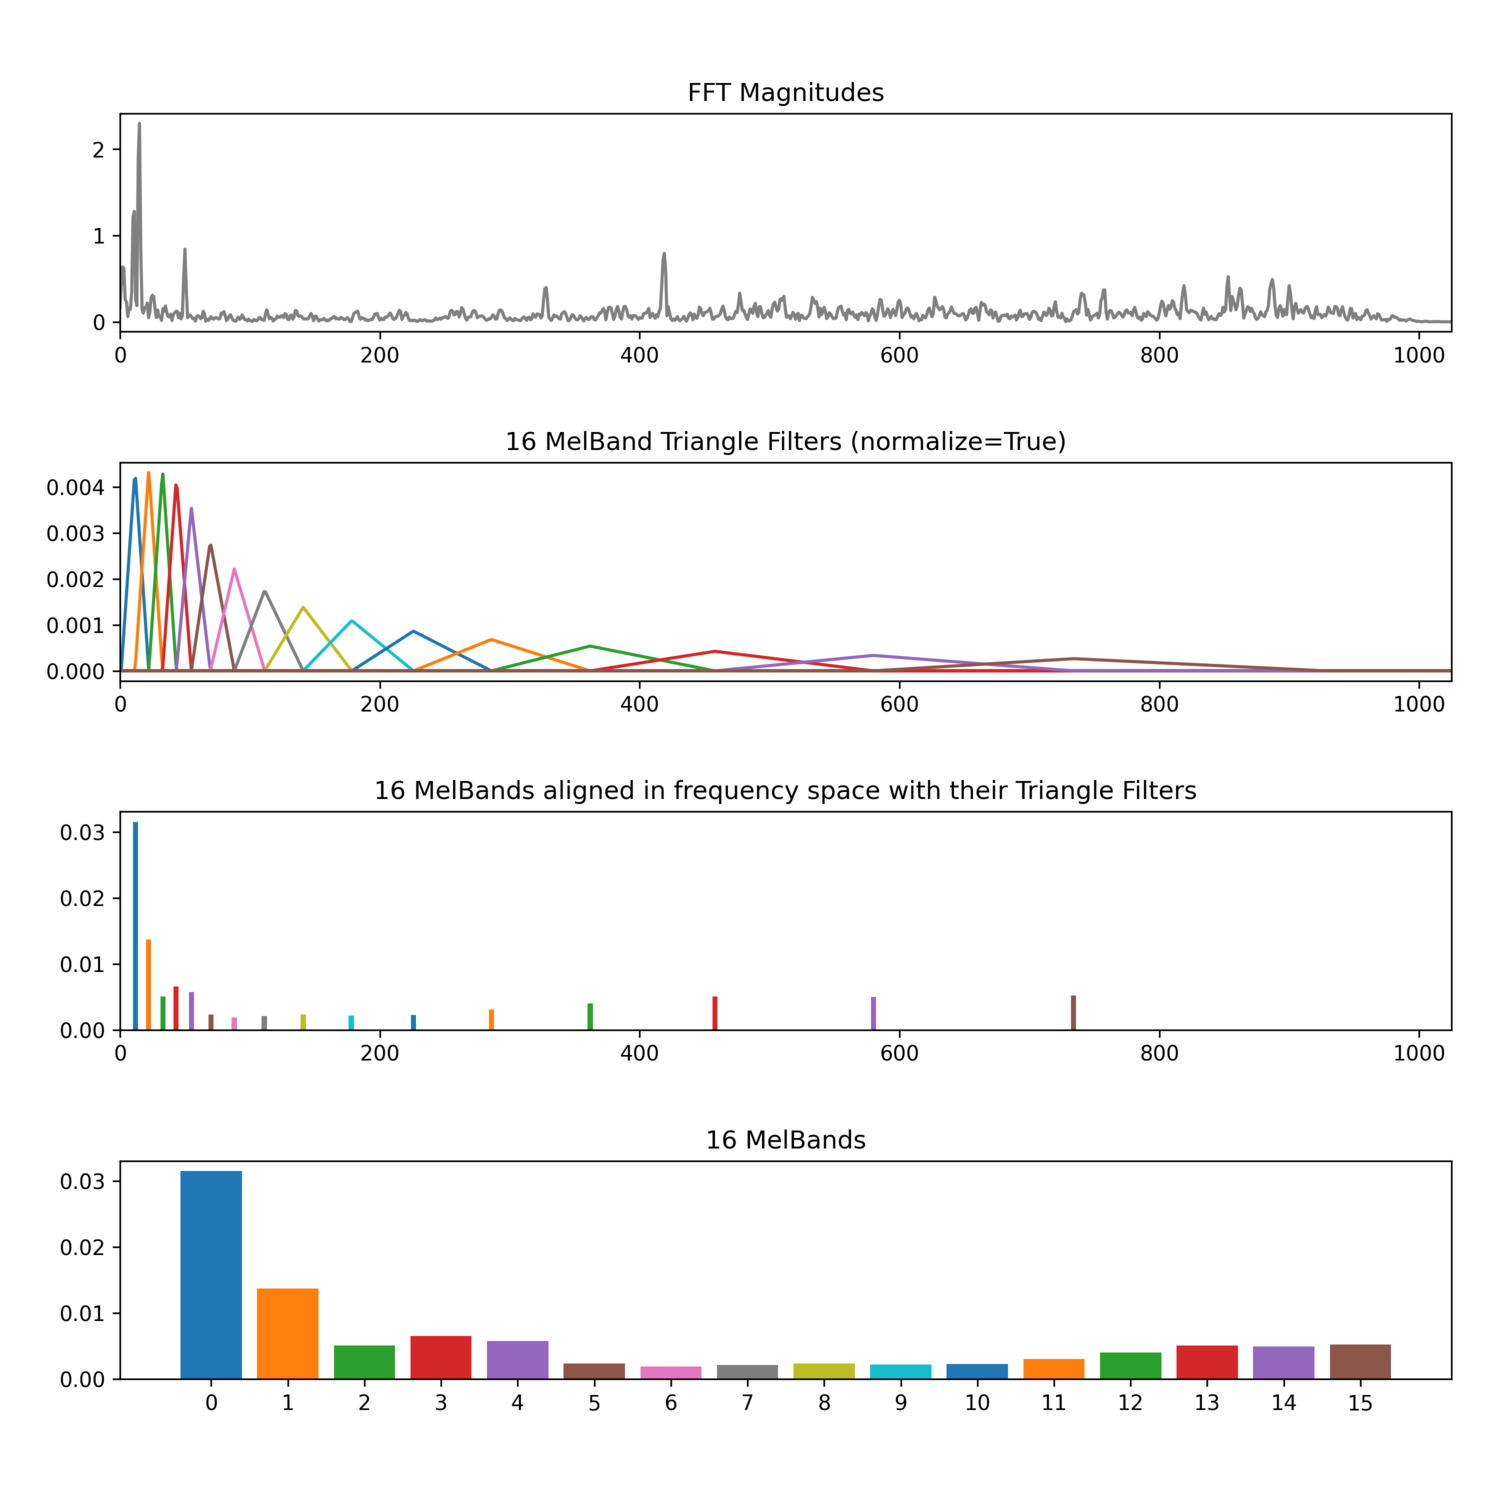
One spectral frame from a drum loop with accompanying triangle filters (normalized) and MelBands.
MelBands analysis of one spectral frame of a trombone tone.
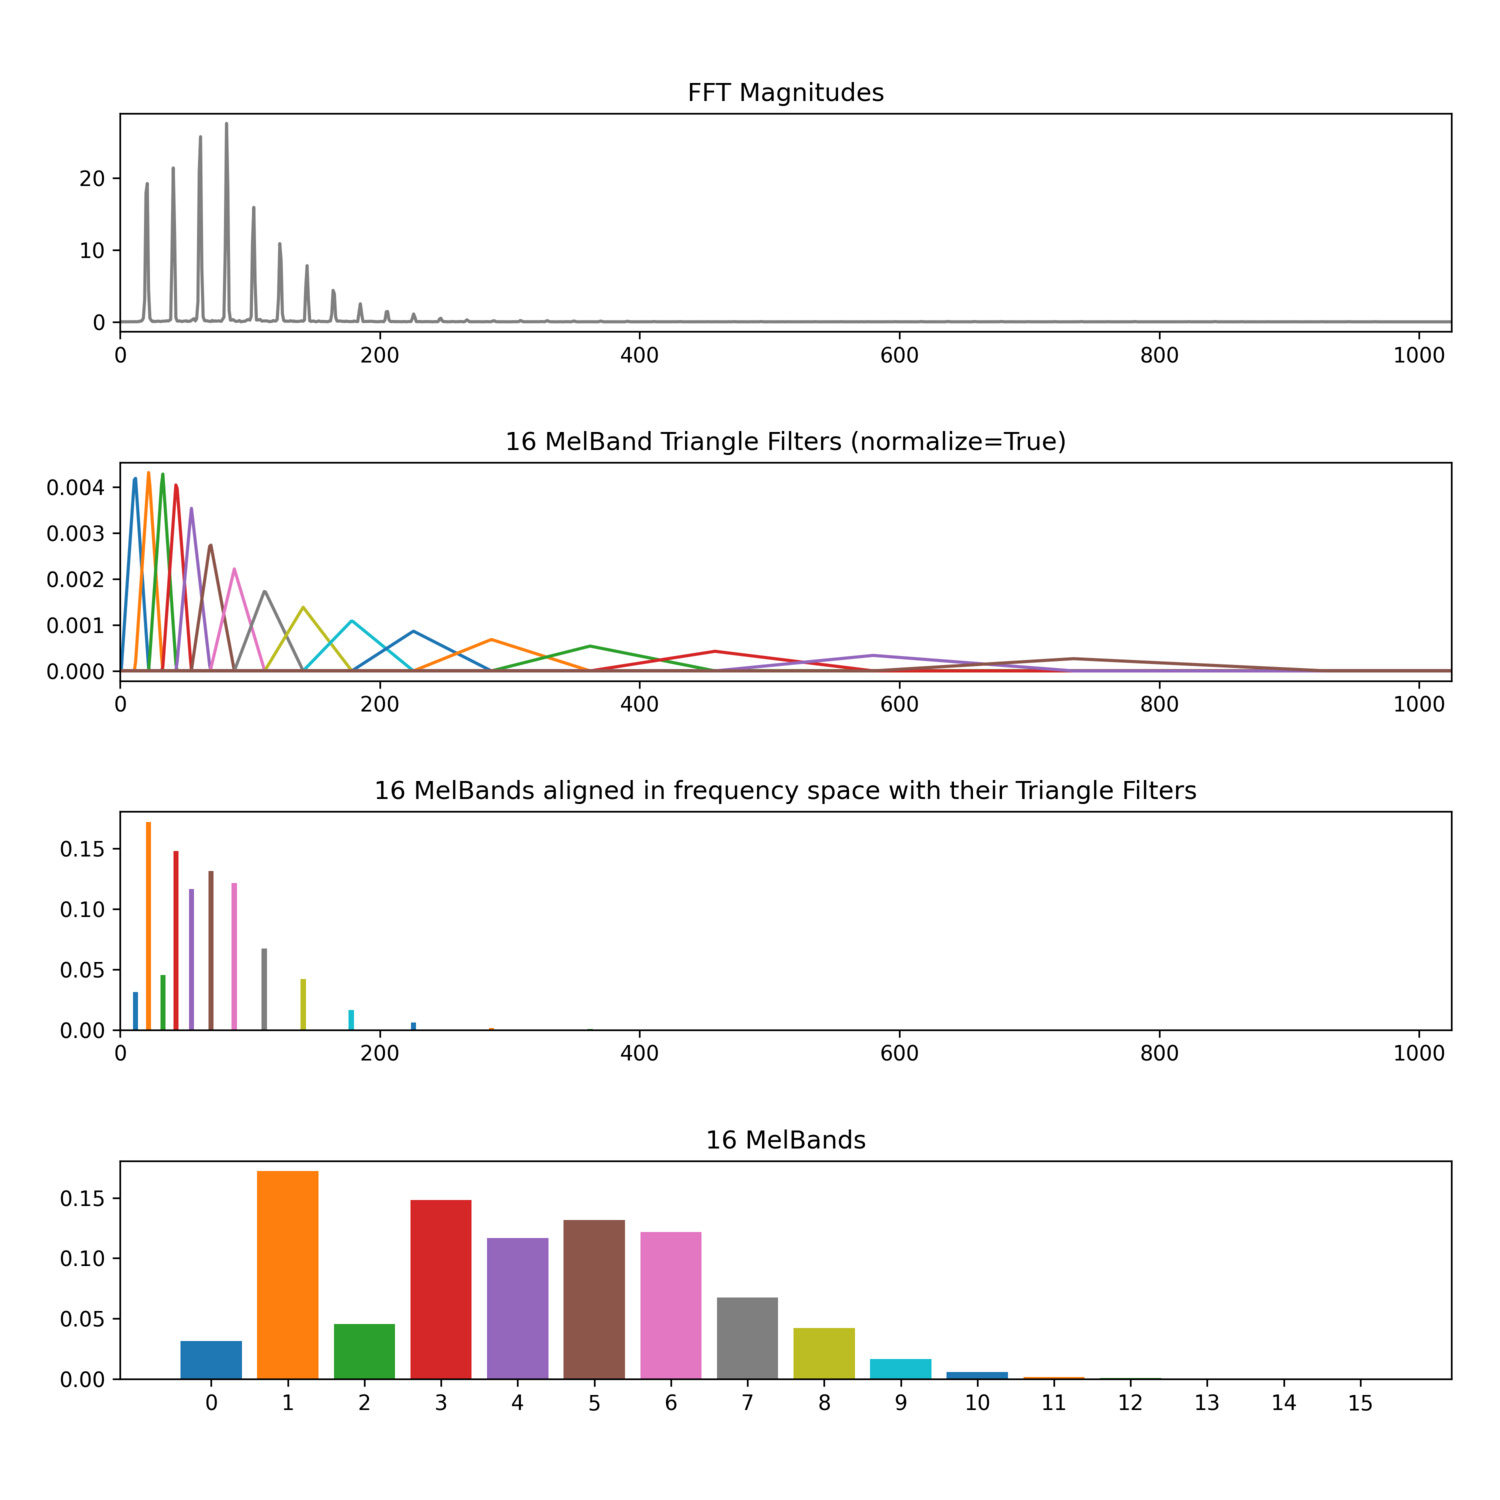
One spectral frame from a trombone tone with accompanying triangle filters (normalized) and MelBands.