
Stats
Calculate real-time statistics
Stats computes the rolling mean and standard deviation for a specified number of previous inputs from a stream of control values. This is different from BufStats, which computes statistics on the values in a static buffer. The number of previous inputs used by Stats is specified by the history parameter. Stats may help smooth out a signal that is jittery by giving a statistical summary of the most recent values.
When passed a streaming list of values, the history and statistics of element is dealt with individually, providing these statistics for each dimension of a multi-dimensional input (such as multidimensional descriptors like SpectralShape, MFCC, and MelBands).
Mean
The average value of the data. This is calculated by adding up all the numbers and the dividing by how many numbers there are. The mean can be used to describe the central tendency of a set of values.
Standard Deviation
Standard deviation describes of the amount of variation within the data in relation to the mean, which implies that it may only be useful when the mean truly represents a central tendency of the data. A lower standard deviation indicates that the values are generally nearer to the mean, while a higher standard deviation indicates that many values are more spread out, further from the mean. Standard deviation is measured in the same units as the data itself.
Standard deviation could also help calculate where most of our data points can be found. For more information about the normal distribution and the 68/95/99.7 rule see the learn page on distribution and histograms.
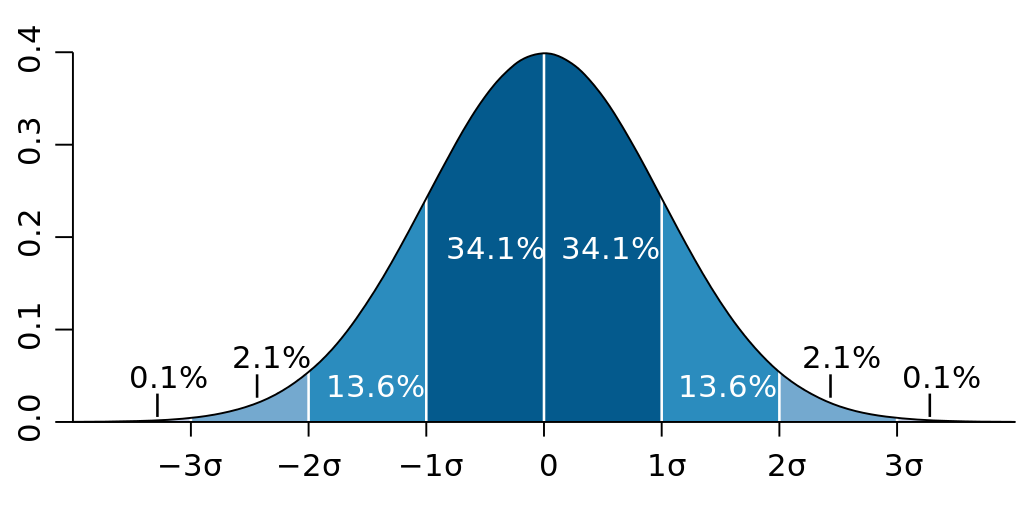
When data is normally distributed, it follows the 68/95/99.7 rule, indicating how much of the data is found within standard deviations of the mean. (image reproduced from Wikipedia)