
NoveltySlice
Onset detection with novelty slicing
NoveltySlice provides a broad concept for thinking about how we might be able say this bit of a sound is different from that bit. It’s useful for slicing when we want a more general basis for distinguishing between segments than looking for the start of well defined events with onsets, transients or changes in the envelope. It can be especially useful when we’re interested in making longer slices than you might get with these typically more finely-grained methods.
There could be many ways of coming up with a measure of novelty. The one that we use in the Fluid Corpus Manipulation Toolkit works by constructing a map of how different each chunk of a signal is to every other chunk. To do this, we transform the sound into the spectral domain using an STFT, meaning that each chunk can now represented by the magnitudes in each bin. How similar each chunk is to another can then be estimated using a distance measure, and we end up with a grid or self-similarity matrix (SSM) that maps the difference between each point in time to every other point in time. An SSM looks like this when we visualise it. Reading it might be somewhat overwhelming, but the basic gist is that for any time point on either axis, we can “lookup” another point in time to see if it is similar. In this particular example, we can see that the structure of the audio is very repetitive, denoted by the almost unbroken diagonal lines.

For an interactive example of an SSM see this website which visualises the self-similarity of lyrics in popular music tracks. In effect, it shows how the same words and phrases get repeated at different points in the song structure, perhaps giving us an idea about the musical structure as a consequence.
What we’re interested in is how much “novelty” appears to be present from one moment to the next, in other words, over a given window of time how similar is “now” to the past. We can find this out from our SSM by adding together all the differences in a window around a given moment, and making a “novelty curve”. Then, we can estimate likely places to make slices by looking for peaks in this curve. If we’re interested in longer slices, one thing we can do is to make the time window that we sum together larger (the kernel size). Additionally, we can apply smoothing to the novelty curve to suppresses smaller / shorter peaks and focus instead on larger / longer ones. Below is a depiction of a novelty curve (in blue), computed on the self-similarity matrix you can see above with a kernel size of 41. The detected peaks (aka slice points) that come out of this with process (with a threshold of 0.25) are marked in red.
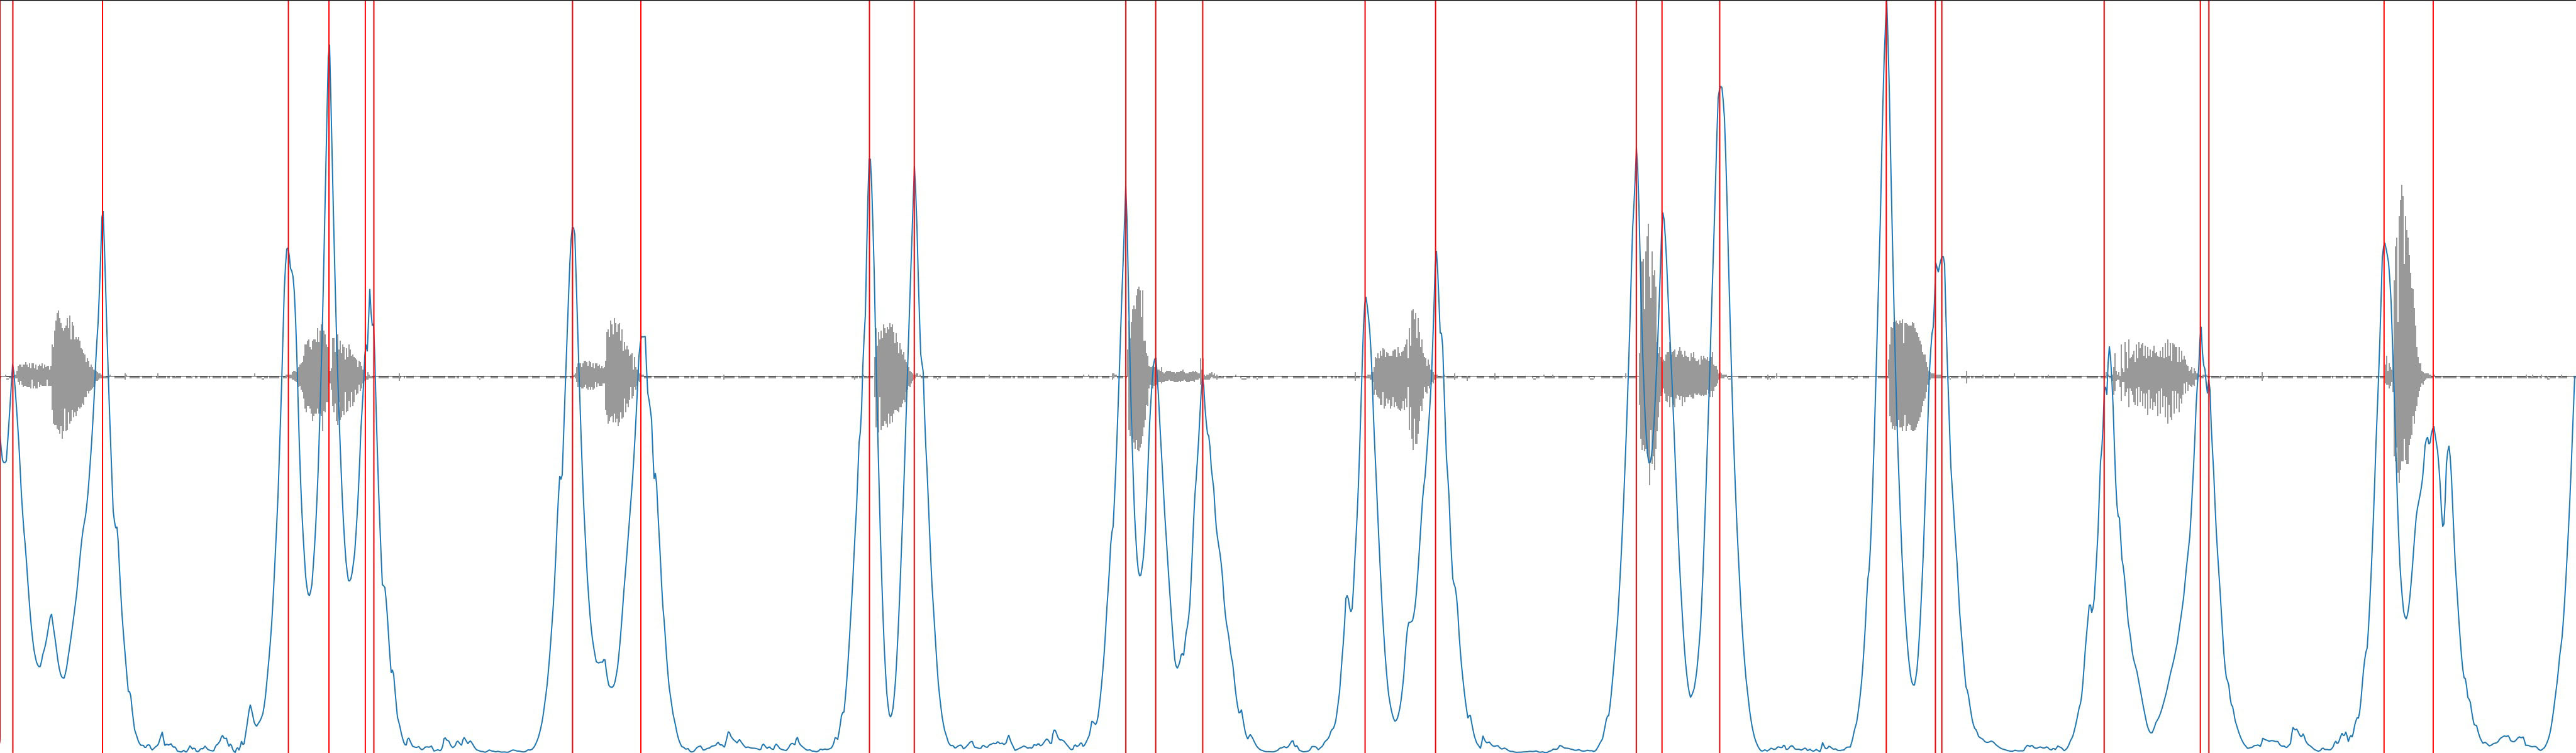
Novelty curve (blue) computed on Tremblay-AaS-VoiceQC-B2K-M (grey), with peaks (red) identified as slice points.
This kind of approach is very flexible, because it allows us to tune the lengths of the slices that we’re interested in, and to remain relatively ambivalent about the exact properties of the signal that denote novelty (meaning that it may be able to pick up on multiple aspects of what we hear). As such, this kind of technique is quite common in what’s called “structural segmentation” in the Music Information Retrieval field, where the focus is on slicing a relatively long passage, like a complete song or movement, into a number of broad sections.